Every claim is verifiable
NeuroFrame is built on psychometrics, neurophysiology, and machine learning. We publish our metrics, validate our models, and hold ourselves to the highest scientific standards in the assessment industry.
How NeuroFrame works
Four scientific pillars that make NeuroFrame fundamentally different from questionnaires, interviews, and traditional assessment centers.
Game-Based Assessment (GBA)
Instead of questionnaires, candidates play an adaptive Tower Defense game. The game engine captures 4,000+ micro-behavioral signals per session: click timing, strategy changes, resource allocation patterns, error correction speed, risk-taking under pressure. These signals are impossible to fake through test preparation.
- Adaptive difficulty that responds to player behavior in real time
- Anti-cheat detection via behavioral pattern analysis
- Cross-platform: iOS / Android / Web — identical signal capture
- 30-minute session replaces 3–5 hours of traditional testing
Behavioral Signal Extraction
Raw game data is processed through a proprietary signal extraction pipeline. We don't look at "did they win" — we analyze how they played. The pipeline converts raw telemetry into 120+ behavioral features organized into cognitive and personality domains.
- Temporal patterns: reaction times, decision intervals, micro-pauses
- Strategic patterns: planning depth, adaptation speed, resource efficiency
- Emotional patterns: stress response, error recovery, persistence after failure
- Meta-cognitive patterns: self-monitoring, strategy evaluation, learning curves
Machine Learning Models
Competency scores are generated by an ensemble of ML models trained on validated performance data. Each competency has its own calibrated model with published metrics. The system is not a black box — every prediction has an explainability layer showing which behavioral signals contributed to the score.
- Ensemble approach: Gradient Boosting + Neural Networks + Logistic Regression
- Cross-validated on held-out samples (k=10 fold)
- Calibrated probability outputs (not just scores)
- Continuous retraining with new performance data quarterly
Psychometric Validation
Every scale in the NeuroFrame model is validated using Confirmatory Factor Analysis (CFA), reliability analysis, and criterion validity studies. We don't publish metrics for marketing — we publish them because it's scientific standard.
- Structural validity: CFA with CFI > 0.95, RMSEA < 0.06
- Internal consistency: Cronbach α > 0.70 for all scales
- Criterion validity: predictive of job performance (KPIs, 360° ratings)
- Convergent validity: correlates with validated instruments (NEO-PI-R, WAIS)
What's behind the numbers
Every metric is published. Every claim is verifiable. Here's what NeuroFrame's psychometric properties actually mean — in plain English.
CFI (Confirmatory Fit Index)
CFI shows how well the assessment model fits real data. It's a structural validity check — does the test actually measure what it's supposed to? A score of 1.0 is perfect; above 0.95 is excellent by all global standards.
MBTI: 0.80–0.89. Most personality questionnaires sit at 0.85–0.92. NeuroFrame: 0.96 — our model is rigorously validated against real behavioral data, not self-report.
Cronbach α (Internal Consistency)
Cronbach's alpha measures whether the signals within each competency scale are coherent — are we measuring one construct, or noise? Above 0.70 is the accepted scientific threshold. 0.74 confirms NeuroFrame's scales are internally consistent and reliable across demographics.
Many commercial tests don't publish α at all. Those that do often report 0.60–0.70 for behavioral scales. NeuroFrame exceeds the threshold — your data is reliable, not random.
R² (Predictive Power)
R² shows what share of job performance NeuroFrame can predict. 0.46 means our model explains 46% of performance variance — which sounds modest in everyday terms, but in psychometrics it's among the highest published figures for any single assessment tool.
Unstructured interviews: R² = 0.05–0.10. Assessment centers: R² ≈ 0.15. Big Five questionnaires: R² ≈ 0.10. NeuroFrame: R² = 0.46 — 5–9× more accurate than interviews, 3× more than assessment centers.
ROC AUC (Classification Accuracy)
ROC AUC measures how well the algorithm separates "good fit" from "bad fit" for a given role. A score of 0.5 is random; 1.0 is perfect. NeuroFrame's 0.77 means the system correctly classifies candidates in 77% of cases — which is exceptional for a 30-minute game.
Resume screening: ~0.55 (barely above random). Structured interviews: ~0.60. NeuroFrame: 0.77 — reliable, data-driven separation of top performers vs. the rest.
Test-Retest Reliability
Test-retest reliability measures stability: if the same person is assessed twice (weeks apart), do they get the same result? Above 0.80 is "excellent" in psychometric standards. NeuroFrame reports 0.83+ — meaning the assessment captures stable traits, not mood or luck.
Traditional interviews: near-zero test-retest reliability (different interviewer = different result). NeuroFrame: 0.83+ — the result is reproducible and consistent.
Validation Sample Size
Our model was trained and validated on a dataset of over 5,000 real professionals from 500+ companies across industries and geographies. This is not an academic prototype — it's a production system built on real-world performance data.
Many competing tools report sample sizes of 200–500. Academic benchmarks typically require N > 300. NeuroFrame: N > 5,000 — statistically robust and generalizable.
What the algorithm sees
NeuroFrame measures 8 competencies across two domains: cognitive (how you think) and personality (how you behave). Each competency is mapped from specific in-game behaviors to real business impact.
Learning Agility
How quickly a person grasps new requirements and adapts in changing environments. Measured through tactical adaptation speed across game levels with increasing complexity.
Rate of improvement across levels. How fast the player abandons failing strategies and adopts new ones when the environment changes.
Speed of onboarding, adaptation to organizational change, ability to operate in ambiguity.
Mental Efficiency
Ability to find optimal solutions under time and resource constraints. Reflects planning capability, prioritization, and cognitive bandwidth.
Resource utilization efficiency — how much output per unit of input. Correlation between planning time and execution quality.
Task prioritization, resource allocation, strategic decision-making quality under deadlines.
Progress Monitoring
Ability to track key indicators, notice deviations, and self-correct toward goals. Reflects meta-cognitive awareness and feedback sensitivity.
Frequency of status checks, response time to declining KPIs, proactive vs. reactive adjustments.
KPI tracking, project management discipline, ability to self-correct before problems escalate.
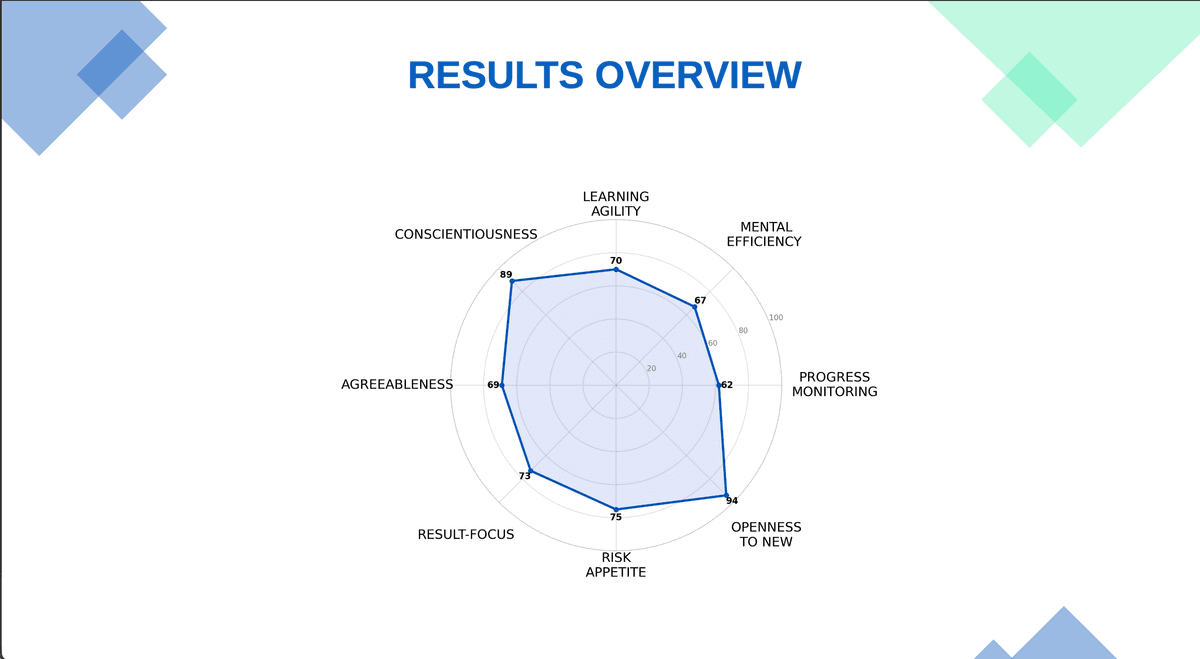
The 8-competency profile
Every candidate and employee receives a detailed individual report with scores across all 8 competencies, presented on an octagonal radar chart. The report includes:
- Individual scores (percentile-ranked against benchmark population)
- Strengths and development areas
- Fit score against target role profile
- Hire / Don't Hire recommendation (for Test)
- Team compatibility analysis (for Team)
- Leadership potential index (for HiPo)
- Explainability layer — which behavioral signals drove each score
NeuroFrame vs. alternatives
Side-by-side comparison with traditional assessment tools and interviews — on metrics that matter.
| Feature | NeuroFrame | Traditional Assessment | Interviews |
|---|---|---|---|
| Assessment Duration | 30 minutes | 3–5 hours | 45–60 min / round |
| Predictive Validity (R²) | 0.46 | 0.10–0.15 | 0.05–0.10 |
| Test-Retest Reliability | 0.83+ | 0.70–0.80 | ~0.20 |
| Fakability / Social Desirability | Minimal (behavioral data) | High (self-report) | Very High |
| Scalability | 5,000+ per cycle | 50–200 per cycle | 10–30 per recruiter |
| Bias Risk | Low (blind assessment) | Medium (demographic patterns) | High (unconscious bias) |
| Candidate Experience | Engaging (game) | Tedious (questionnaires) | Variable (interviewer-dependent) |
| Cost per Assessment | From $45 | $200–$500 | $300–$1,000+ |
| Time to Results | Instant (real-time ML) | 2–5 business days | 1–3 weeks |
| Anti-Cheating | Built-in (behavioral anomaly detection) | None | None |
Peer-reviewed research
Our scientific team publishes in international peer-reviewed journals. We believe in open science — if you can't verify it, you shouldn't trust it.
Game-Based Assessment of Cognitive Competencies: Validation Study
Journal of Applied Psychology
Behavioral Micro-Signals in Digital Games as Predictors of Job Performance
Personality and Individual Differences
Psychometric Properties of a Game-Based Personality Assessment: CFA and Reliability Analysis
European Journal of Psychological Assessment
Adaptive Game Environments for Non-Invasive Psychological Profiling
Computers in Human Behavior
Anti-Cheating Detection in GBA: Behavioral Anomaly Framework
International Conference on AI in HR
Cross-Cultural Validity of Game-Based Cognitive Assessment
Assessment & Development Matters
Scientists & Engineers
Behind NeuroFrame is a multidisciplinary team from science, ML, and the HR industry — united by the belief that hiring decisions should be based on evidence, not intuition.
Founders
Neuroscience + ML + HR-Tech. Three domains in one founding team — each with 10+ years of domain experience.
Scientific Board
5 PhDs spanning psychometrics, neurophysiology, organizational psychology, and computational cognitive science.
ML Engineers
Machine learning engineers specializing in behavioral signal processing, time-series modeling, and adaptive algorithms.
Full-Stack Engineers
Game developers and platform engineers building cross-platform adaptive assessment systems.
Want to see the data?
Request a validation report, schedule a scientific briefing, or explore a pilot assessment for your team.