Every claim is verifiable
NeuroFrame is built on psychometrics, neurophysiology, and machine learning. We publish every metric together with the sample it was obtained on, and we name the limits of the method.
How NeuroFrame works
Four scientific pillars that make NeuroFrame fundamentally different from questionnaires, interviews, and traditional assessment centers.
Game-Based Assessment (GBA)
Instead of questionnaires, candidates play an adaptive Tower Defense game. The engine records thousands of digital traces per session — clicks, pauses, reaction speed, changes of decision. The person is not reporting on themselves, so there are no answers to rehearse.
- Adaptive difficulty that responds to player behavior in real time
- Anti-cheat detection via behavioral pattern analysis
- Cross-platform: iOS / Android / Web — identical signal capture
- One 30–60 min session instead of a multi-hour battery of tests
Behavioral Signal Extraction
Raw game data is processed through a proprietary signal extraction pipeline. We don't look at "did they win" — we analyze how they played, including what the player passed up: the opportunity cost of every decision. The output is organized into the cognitive and personality domains.
- Temporal patterns: reaction times, decision intervals, micro-pauses
- Strategic patterns: planning depth, adaptation speed, resource efficiency
- Emotional patterns: stress response, error recovery, persistence after failure
- Meta-cognitive patterns: self-monitoring, strategy evaluation, learning curves
Machine Learning Models
Competency scores are generated by ML models trained on validated performance data. Each competency has its own calibrated model with published metrics. The system is not a black box — every prediction has an explainability layer showing which behavioral signals contributed to the score.
- Every parameter has its own calibrated model, with its metrics published
- Cross-validated on held-out samples (k=10 fold)
- Calibrated probability outputs (not just scores)
- The full evidence model — construct, behavior, task — goes to the client's methodologists under NDA
Psychometric Validation
Every scale in the NeuroFrame model is validated using Confirmatory Factor Analysis (CFA), reliability analysis, and criterion validity studies. We don't publish metrics for marketing — we publish them because it's scientific standard.
- Structural validity: CFA confirms the two-domain model, CFI = 0.96
- Internal consistency: Cronbach α = 0.69–0.77 across the eight scales
- Criterion validity: tested against real KPIs and manager ratings on 3,000+ employees
- Convergent validity: cognitive scales correlate with Raven's Progressive Matrices and Saville
What's behind the numbers
Every metric is published. Every claim is verifiable. Here's what NeuroFrame's psychometric properties actually mean — in plain English.
CFI (Confirmatory Fit Index)
CFI shows how well the assessment model fits real data. It's a structural validity check — does the test actually measure what it's supposed to? A score of 1.0 is perfect; above 0.95 is excellent by all global standards.
Obtained by confirmatory factor analysis on behavioral data, not on self-report: the two-domain model — cognition and personality — holds on real sessions. Many popular instruments publish no fit indices at all.
Cronbach α (Internal Consistency)
Cronbach's alpha measures whether the signals within each competency scale are coherent — are we measuring one construct, or noise? 0.70 is the conventional threshold. NeuroFrame reports 0.69–0.77 across the eight scales — the bottom of that range sits right at the threshold, and we publish it instead of quoting only the top.
We publish the full range across all eight scales, not the single best one. Many commercial tests don't publish α at all.
ROC AUC (Ranking Accuracy)
ROC AUC measures how well the algorithm separates fit from non-fit for a given role. A score of 0.5 is random; 1.0 is perfect. NeuroFrame's 0.77 means that, given one person who fits the role and one who doesn't, the model puts them in the right order about three times out of four.
Reported with the criterion it was obtained against: real KPIs and manager ratings on 3,000+ employees. What it separates is fit to a specific role — not people into better and worse.
Test-Retest Reliability
Test-retest reliability measures stability: if the same person is assessed twice (weeks apart), do they get the same result? Above 0.80 is "excellent" in psychometric standards. NeuroFrame reports > 0.83 — meaning the assessment captures stable traits, not mood or luck.
Interviews rarely report this figure at all — a different interviewer produces a different result. NeuroFrame publishes it, and the result is reproducible.
Sample Size (Benchmark and Validation)
Two different samples, and we name both. The comparison base is 14,850 executives and entrepreneurs from 500+ companies, 21+ industries and 21+ functional areas — that's who a candidate is measured against. Predictive value was then tested on 3,000+ employees against their real KPIs and manager ratings.
Reported with its provenance: who is in the sample, from how many companies and what it is used for. Many popular instruments do not publish sample composition at all.
What the algorithm sees
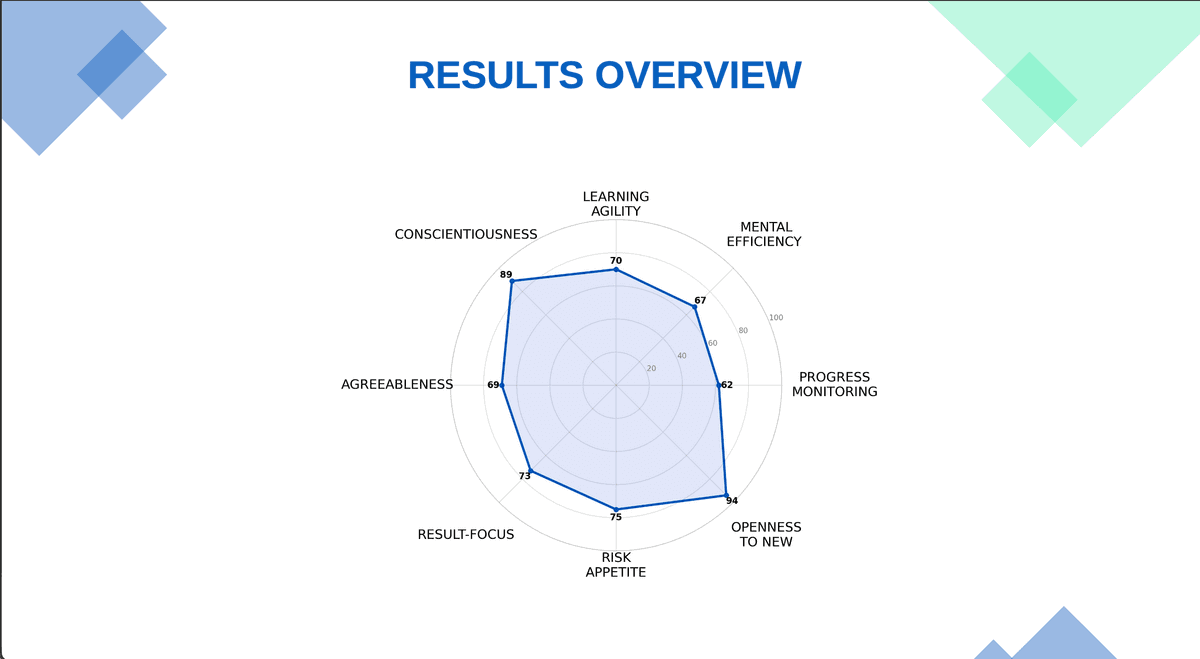
NeuroFrame measures 8 competencies across two domains: cognitive (how you think) and personality (how you behave). Each competency is mapped from specific in-game behaviors to real business impact.
Mental Efficiency
Ability to find optimal solutions under time and resource constraints. Reflects planning capability, prioritization, and cognitive bandwidth.
finds an effective solution quickly and allocates limited resources with a minimum of wasted actions.
Task prioritization, resource allocation, strategic decision-making quality under deadlines.
Learning Agility
How quickly a person extracts the lesson from new experience and carries it over to a harder task. Reflects the depth of the transfer, not reaction speed alone.
picks up unfamiliar rules quickly and moves from trial attempts to consistently sound decisions.
Speed of onboarding, adaptation to organizational change, ability to operate in ambiguity.
Progress Monitoring
Ability to track key indicators, notice deviations, and self-correct toward goals. Reflects meta-cognitive awareness and feedback sensitivity.
thinks a move through in advance, notices the weak point as the situation unfolds and corrects the plan before the problem develops.
KPI tracking, project management discipline, ability to self-correct before problems escalate.
The 8-competency profile
Every candidate and employee receives a detailed individual report with scores across all 8 competencies, presented on an octagonal radar chart. The report includes:
- Individual scores (percentile-ranked against benchmark population)
- Strengths and development areas
- Fit score against target role profile
- Role-fit score with the gaps named (for Test)
- Team compatibility analysis (for Team)
- Leadership potential index (for HiPo)
- Explainability layer — which behavioral signals drove each score
NeuroFrame vs. alternatives
Side-by-side comparison with traditional assessment tools and interviews — on metrics that matter.
| Feature | NeuroFrame | Traditional Assessment | Interviews |
|---|---|---|---|
| Assessment Duration | 30–60 min | 3–5 hours | 45–60 min / round |
| Predictive Validity | AUC 0.77, against real KPIs and manager ratings | Published by some instruments, not by others | Established for structured interviews (Schmidt & Hunter, 1998), not for unstructured ones |
| Test-Retest Reliability | > 0.83, published | Reported by some publishers | Different interviewer — different result |
| Fakability / Social Desirability | Minimal (behavioral data) | High (self-report) | Very High |
| Scalability | Limited by codes issued, not by assessor time | 50–200 per cycle | 10–30 per recruiter |
| Bias Risk | Low (blind assessment) | Medium (demographic patterns) | High (unconscious bias) |
| Candidate Experience | Engaging (game) | Tedious (questionnaires) | Variable (interviewer-dependent) |
| Cost per Assessment | From $45 | $200–$500 | $300–$1,000+ |
| Time to Results | Instant (real-time ML) | 2–5 business days | 1–3 weeks |
| Anti-Cheating | Built-in (behavioral anomaly detection) | Lie scales and proctoring, where they are used | A rehearsed answer looks like a good one |
Peer-reviewed research
The method rests on peer-reviewed work, and our own validation is published as reports with the samples they were obtained on. We believe in open science — if you can't verify it, you shouldn't trust it.
The validity and utility of selection methods in personnel psychology
Schmidt, F. L., & Hunter, J. E. · Psychological Bulletin, 124(2), 262–274
The meta-analysis the whole field benchmarks selection methods against.
doi:10.1037/0033-2909.124.2.262Revisiting meta-analytic estimates of validity in personnel selection
Sackett, P. R., Zhang, C., Berry, C. M., & Lievens, F. · Journal of Applied Psychology, 107(11), 2040–2068
The stricter re-estimate that corrects range-restriction overcorrection. We report both.
doi:10.1037/apl0000994Cybernetic Big Five Theory
DeYoung, C. G. · Journal of Research in Personality, 56, 33–58
Traits as parameters of a behavioural control system — the interpretive frame for the personality domain.
doi:10.1016/j.jrp.2014.07.004A Brief Introduction to Evidence-Centered Design
Mislevy, R. J., Steinberg, L. S., & Almond, R. G. · ETS Research Report Series
The assessment-engineering methodology: construct → observable behaviour → task designed to elicit it.
doi:10.1002/j.2333-8504.2003.tb01908.xConstruct validity: EFA and confirmatory factor analysis of the two-domain model
CFI = 0.96. Available to clients under NDA.
Criterion validity against KPIs and manager ratings
AUC = 0.77 on 3,000+ employees. Available to clients under NDA.
Reliability: internal consistency and test–retest
Cronbach's α = 0.69–0.77 across the eight scales; test–retest > 0.83.
Scientists & Engineers
Behind NeuroFrame is a multidisciplinary team from science, ML, and the HR industry — united by the belief that hiring decisions should be based on evidence, not intuition.
Founders
Neuroscience + ML + HR-Tech. Three domains in one founding team — each with 10+ years of domain experience.
Scientific Board
5 PhDs spanning psychometrics, neurophysiology, organizational psychology, and computational cognitive science.
ML Engineers
Machine learning engineers specializing in behavioral signal processing, time-series modeling, and adaptive algorithms.
Full-Stack Engineers
Game developers and platform engineers building cross-platform adaptive assessment systems.
Want to see the data?
Request a validation report, schedule a scientific briefing, or explore a pilot assessment for your team.